Analytics, reports and Excel exports
5 steps4 min readUpdated
Afi Planner measures on-time rate, ETA accuracy, stops per hour, miles and customer ratings for the company and each driver, compares each number with the same number of days right before, and exports everything to Excel. Find out how the plan compared with the street, and share it.
In this guide
Step 1: Pick a period
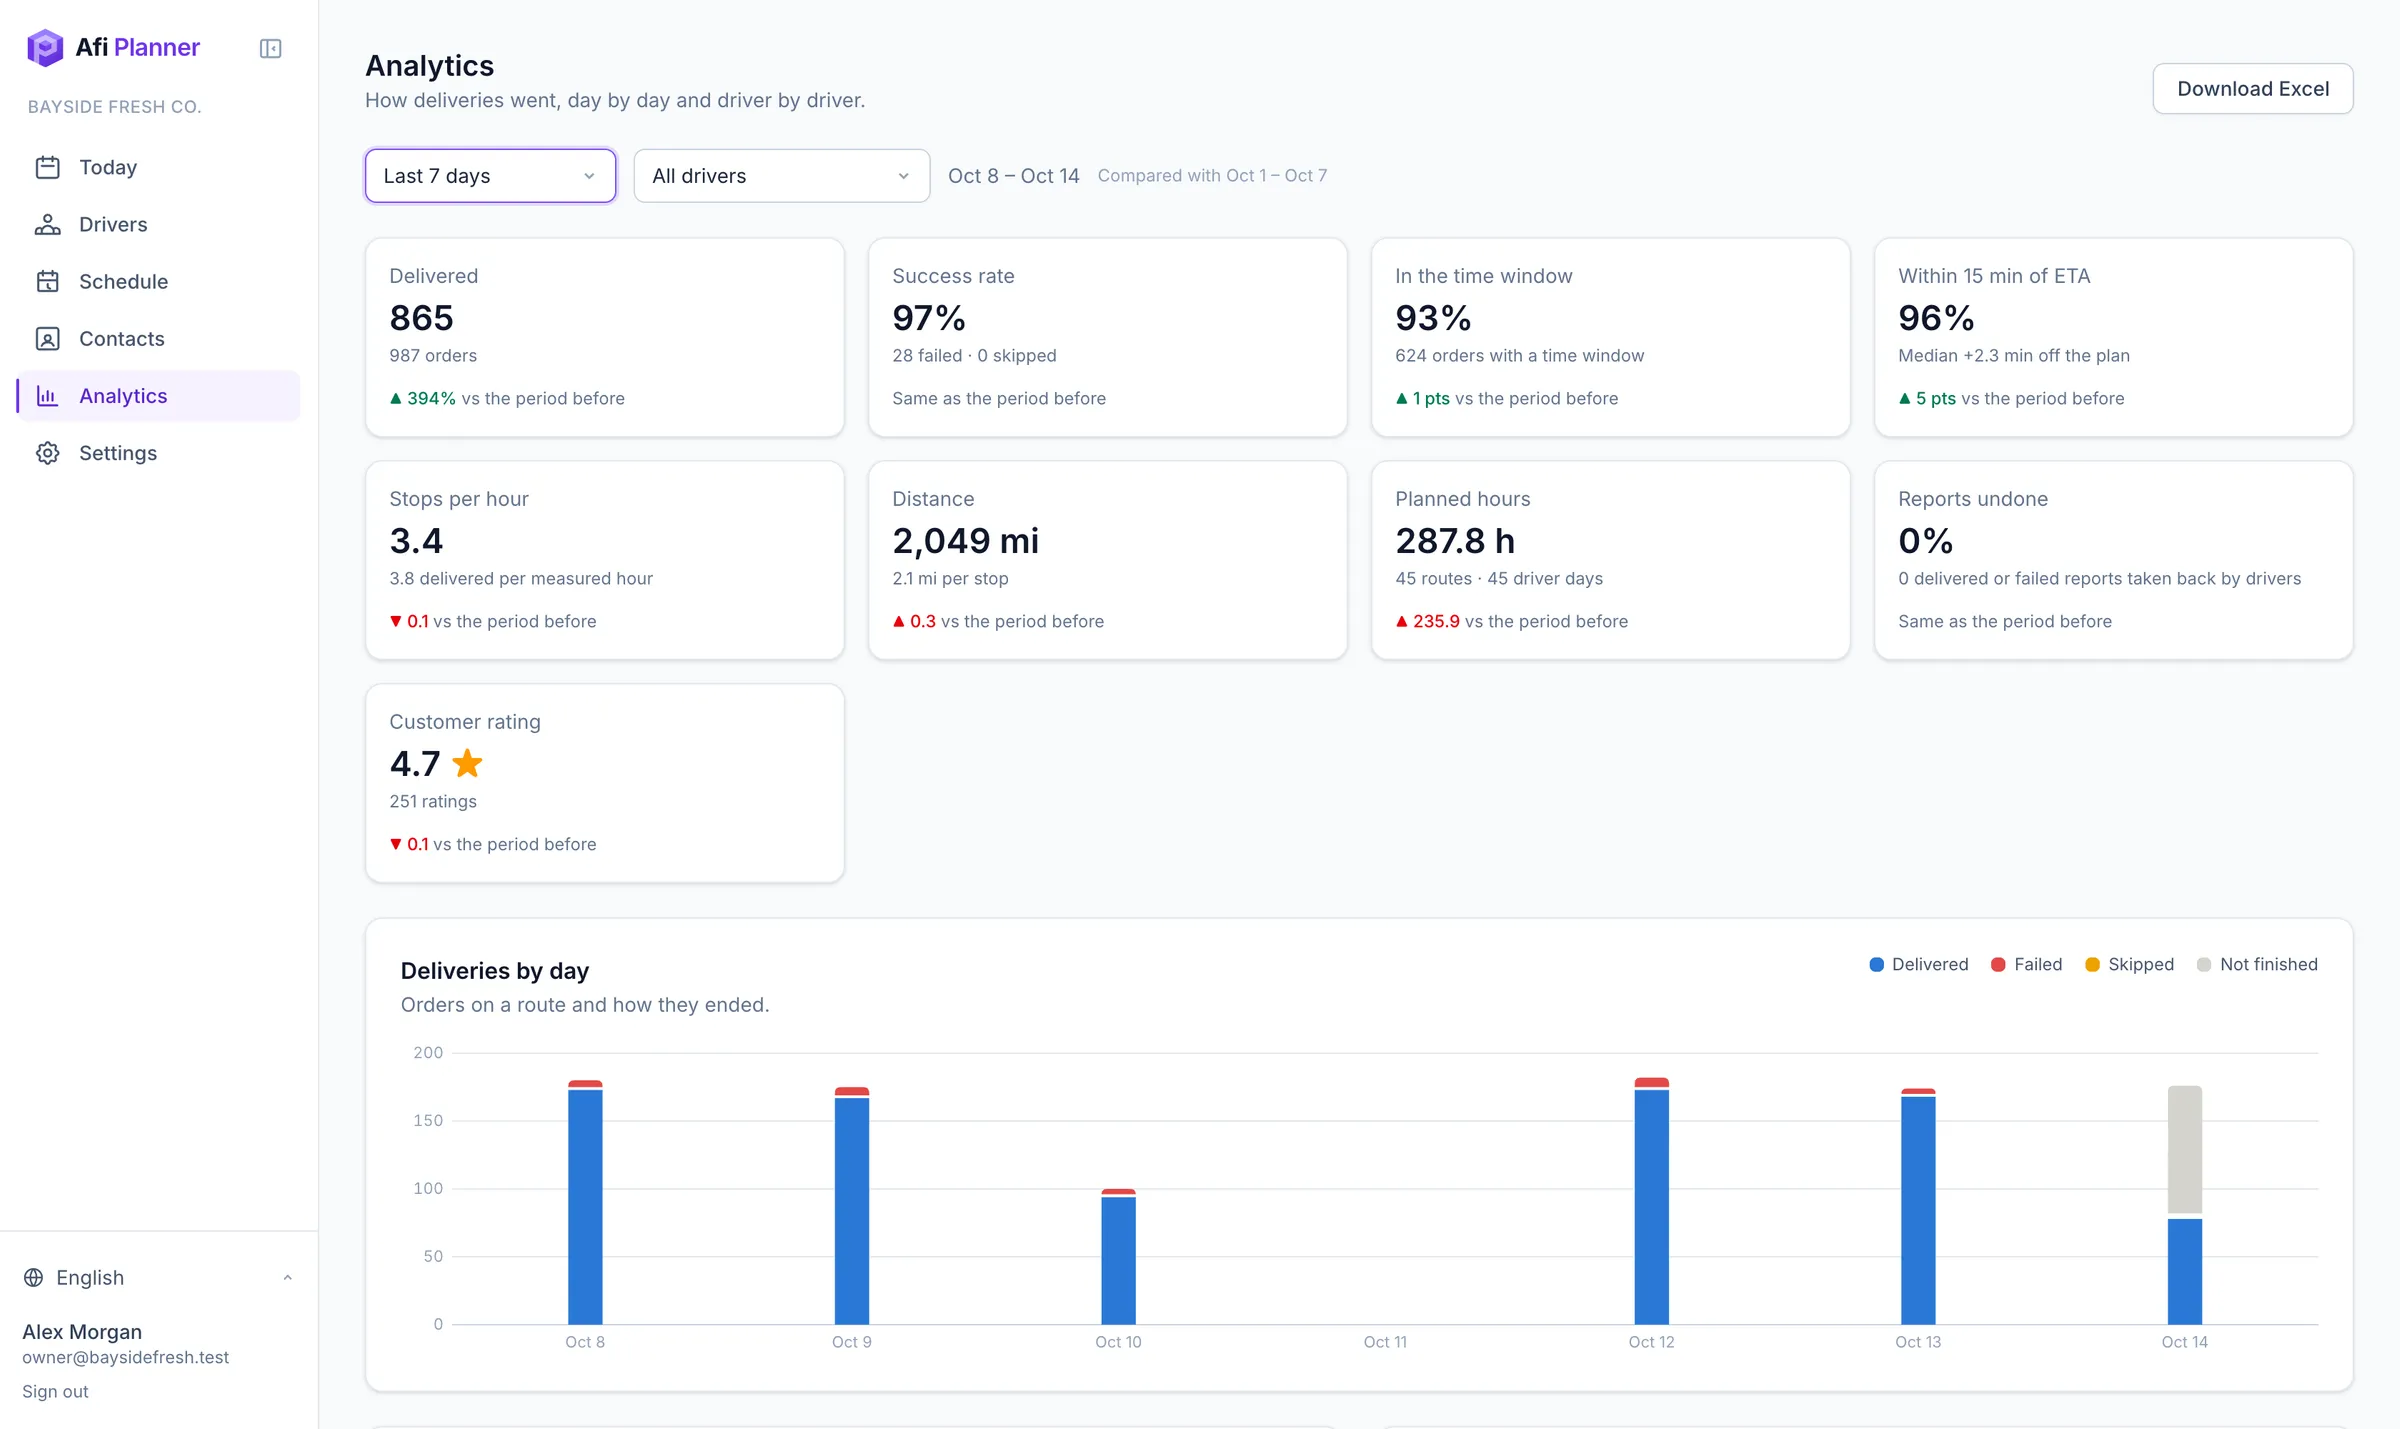
Open Analytics and choose a period and, if you like, one driver. Each number is compared with the period before.
Step 2: Read the key numbers
Delivered, success rate, time windows kept, ETA accuracy (within 15 minutes), stops per hour, miles, planned hours and customer rating.
Step 3: Read the cost per stop
The Cost per stop card divides what your routes cost by the stops delivered. Each route costs your cost per hour times its hours plus your cost per mile times its miles, with the rates from your planning settings and the hours and miles the driver app measured where it reported. Driver pay, fixed vehicle costs and overhead are not inside unless you build them into those two rates. The card also shows what failed deliveries and redeliveries cost, and you can type the cost per stop of your old way to compare, marked as an estimate.
Step 4: Dig into one day
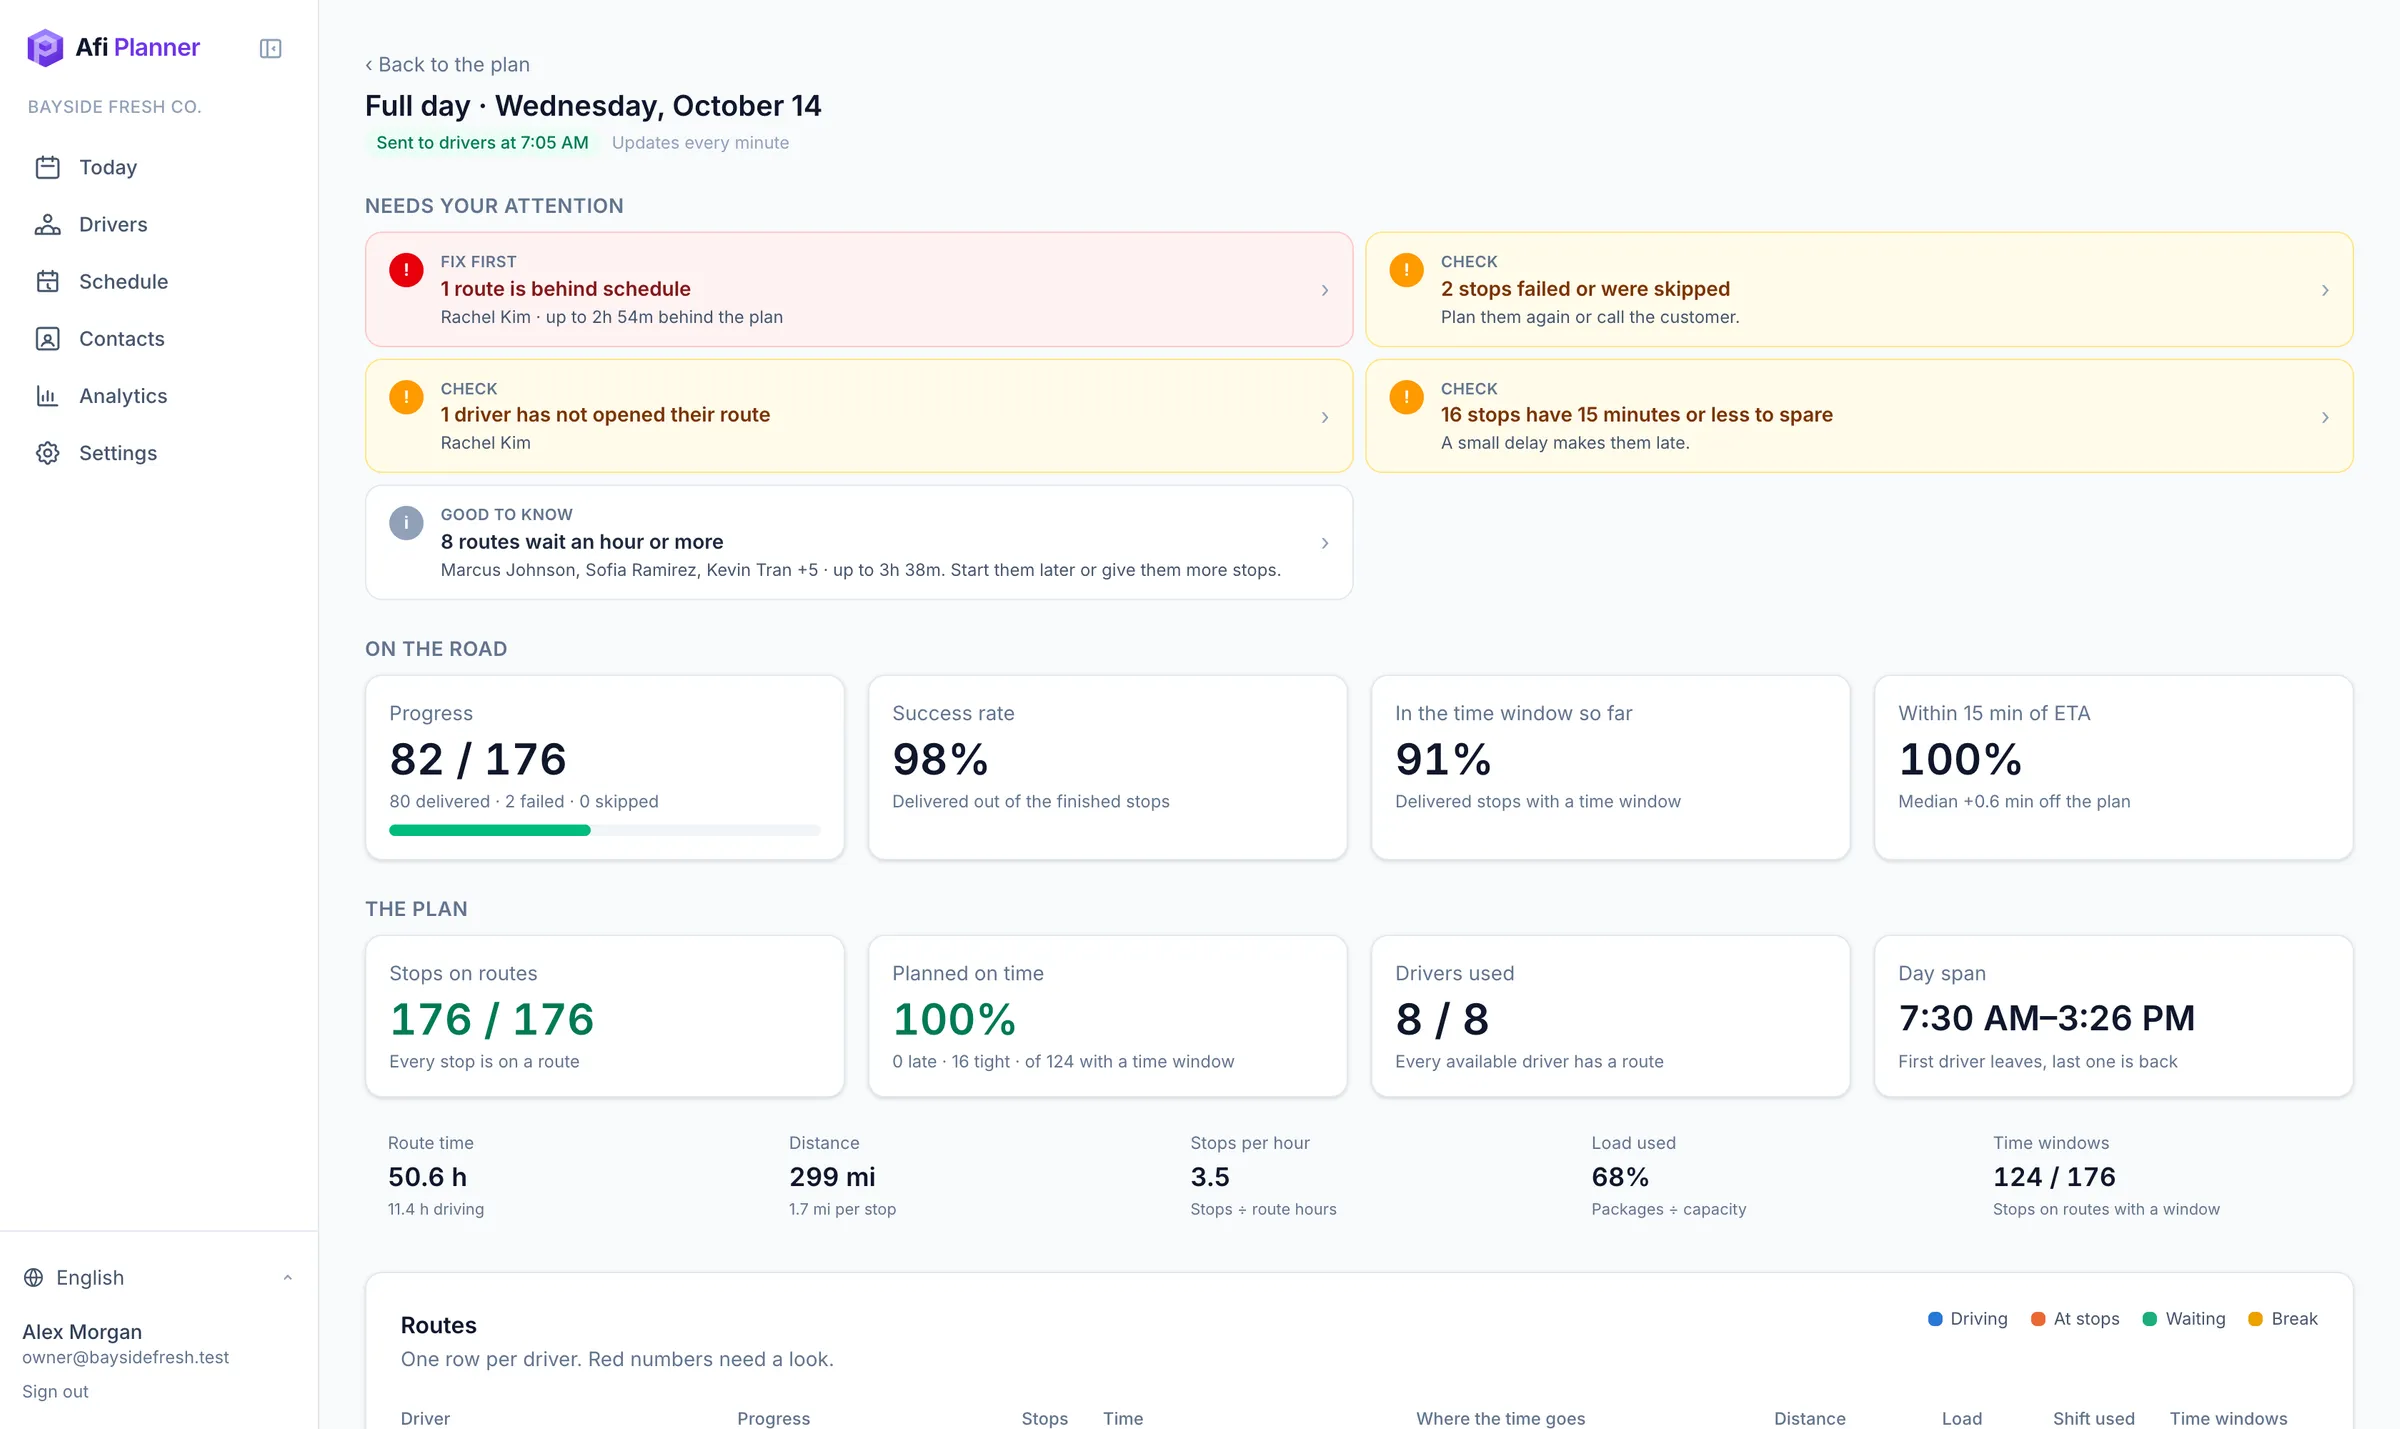
From any day, open Analytics for that plan: alerts first, then each route’s time split, load and shift use.
Step 5: Export
Download Excel from Analytics (By day, Drivers, Orders) or from any day (routes and stops). Print run sheets per driver.
Questions this guide answers
- How do I calculate cost per delivery stop?
- How many stops per hour should a delivery driver make? And how to measure it
- What does each delivery stop cost? A cost per stop calculator
Related questions
Related feature
See how every route really went →